
Master the Market: A Step-by-Step Guide to the S&P 500 Trend Following Strategy
Using Index Filter to determine bull and bear sentiment.

A Simple Yet Effective Market Trend Strategy: Index Filter or Riding the S&P 500 Wave
I did not came up with this strategy. This is taken from Nick Radge in his book: Weekend Trend Trader. It is a very short read and I am highly recommended.
This simple strategy of Index Filter become the backbone of my trading.
Why?
In the complex world of stock market investing, a straightforward approach stands out: the S&P 500 trend following strategy or an Index Filter.
This method, centered on the relationship between the S&P 500 index and its 10-week moving average, offers investors a clear compass for navigating the often turbulent waters of the financial markets.
By aligning your investment decisions with the broader market trend, you can potentially capitalize on upward momentum while protecting your assets during downturns.
The beauty of this approach lies in its simplicity:
When the S&P 500 trades above its 10-week moving average, it signals a bullish trend.
When it falls below, it indicates a potential bearish shift.
These signals guide your actions, telling you when to confidently invest and when to exercise caution.
But why does this matter to you, the investor standing on the deck of your financial ship, gazing out at the vast ocean of market opportunities and risks? Because in a world where complex algorithms and conflicting expert opinions often leave us more confused than enlightened, this strategy offers clarity.
It's not about predicting every market twist and turn, but about understanding and riding the underlying currents that drive significant market movements.
It simplifies decision-making, helps manage risk, and aligns you with the market's momentum.
In this article, we'll explore the mechanics of the strategy, its implementation in real-world scenarios, and the reasoning behind its effectiveness.
Are you ready?
Let's dive deeper into the Index Filter or S&P 500 trend following strategy.
The Core Concept: S&P 500 and the 10-Week Moving Average
Now, let's dive deeper into the S&P 500 and the 10-week moving average, it's time to explore how these two elements come together to form the backbone of our trend-following strategy.
Bullish Signal: When S&P 500 > 10-week MA
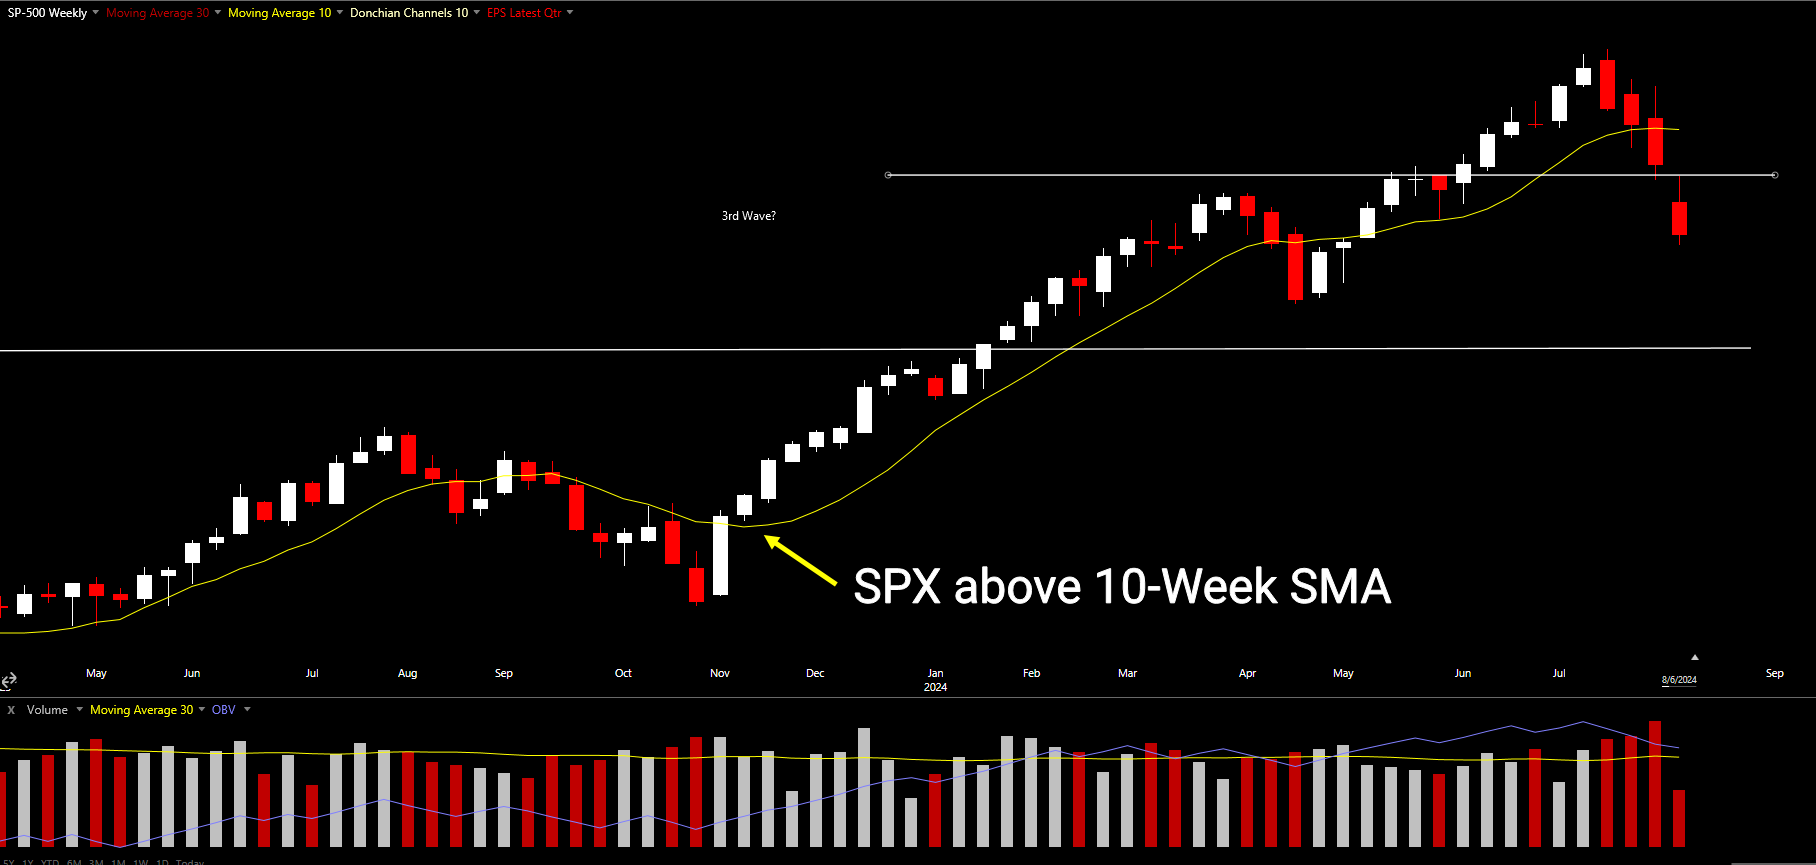
Picture a rocket breaking through the clouds, defying gravity and soaring towards new heights. This is the essence of a bullish signal in our strategy. When the S&P 500 trades above its 10-week moving average, it's as if the market has ignited its engines and is ready for liftoff.
What does this mean in practical terms?
Momentum: The market is showing upward momentum. Like a boulder rolling downhill, it's gathering speed and power.
Strength: Current prices are higher than the recent average, indicating market strength.
Opportunity: This could be a prime time to consider increasing your market exposure.
However, remember that while this signal suggests a positive trend, it's not a guarantee of continuous upward movement. Think of it as a green light at an intersection – it means "go," but you still need to proceed with your own risk and money management in mind.
Bearish Signal: When S&P 500 < 10-week MA
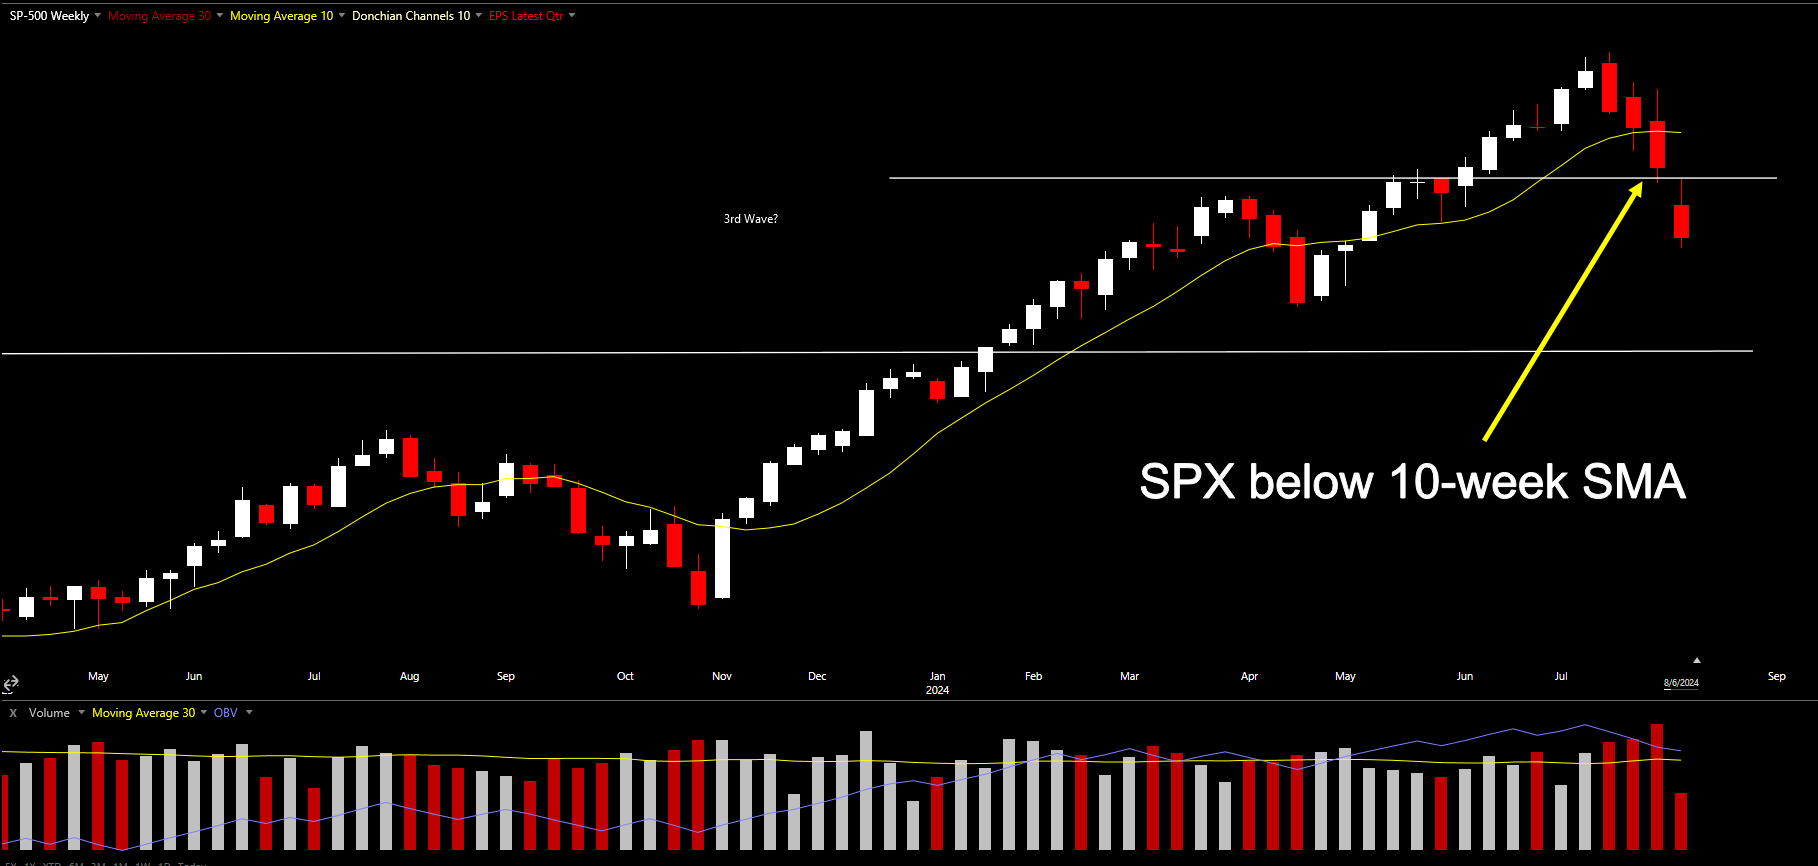
Now, imagine storm clouds gathering on the horizon, with the first raindrops beginning to fall. This is akin to a bearish signal in our strategy. When the S&P 500 falls below its 10-week moving average, it's as if the market is battening down the hatches in preparation for rougher seas ahead.
What are the implications of this scenario?
Weakness: The market is showing signs of losing steam. It's like a marathon runner who's beginning to slow down after miles of steady progress.
Caution: Current prices have dipped below the recent average, suggesting a potential shift in market sentiment.
Risk Management: This could be a signal to adopt a more defensive posture with your investments.
It's crucial to understand that a bearish signal doesn't necessarily predict a market crash or prolonged downturn. Think of it more as a yellow traffic light – a warning to proceed with increased caution and heightened awareness.
The Power of This Approach
The beauty of this core concept lies in its clarity and actionable nature. By comparing the current S&P 500 level to its 10-week moving average, we distill complex market behavior into a binary signal: bullish or bearish. This simplicity can be incredibly powerful, cutting through the noise and providing a clear direction for your investment strategy.
Moreover, this approach is dynamic. As the market ebbs and flows, the relationship between the S&P 500 and its moving average shifts, allowing your strategy to adapt to changing conditions. It's like having a weather vane that constantly updates you on which way the wind is blowing in the financial markets.
As we move forward, we'll explore how to translate these signals into specific actions, balancing the insights they provide with prudent risk management and your personal investment goals. Remember, while these signals offer valuable guidance, they're tools to inform your decisions, not to make them for you. Your judgment is still needed.
Implementing the Strategy in Action
Now that we've grasped the core concepts, it's time to roll up our sleeves and dive into the practical application of our S&P 500 trend following strategy. Think of this as your playbook – a guide to navigating both calm and choppy market waters.
Steps for Bullish Market Conditions
When the S&P 500 is trading above its 10-week moving average, we're in bullish territory. It's like catching a wave at just the right moment – you want to ride it as long as you can. Here's how to capitalize on this upward momentum:
Continue Buying Stocks or Index Funds
With the market trending upwards, it's an opportune time to increase your exposure to equities.
Focus on growth and quality stocks or broad market index funds that track the S&P 500. These are your sturdy surfboards, designed to ride the wave efficiently.
Maintain Normal Stop-Loss Levels
While the trend is your friend, it's crucial not to throw caution to the wind. Keep your stop-loss orders in place as a safety net.
My personal approach is setting stop-losses 30-40% below your purchase price, but adjust based on your risk tolerance and the specific asset's volatility.
Steps for Bearish Market Conditions
When the S&P 500 dips below its 10-week moving average, we've entered bearish waters. It's time to batten down the hatches and adopt a more defensive posture. Here's how to navigate these challenging conditions:
Halt New Purchases
Pause your regular buying strategy to avoid catching a falling knife.
Use this time to reassess your portfolio, market conditions, and build up your watchlist. It's an opportunity to plan your next moves rather than react impulsively.
Remember, this halt is temporary. Stay alert for signs of the market bottoming out or reversing trend.
Tighten Stop-Loss Orders on Existing Positions
Now's the time to shorten the leash on your investments. By tightening your stop-loss orders, you're creating a stronger safety net.
Consider raising your stop-loss levels to lock in more of your gains or limit potential losses. My personal rule is 10% trailing stop loss from the price.
Navigate Market Recovery Scenarios
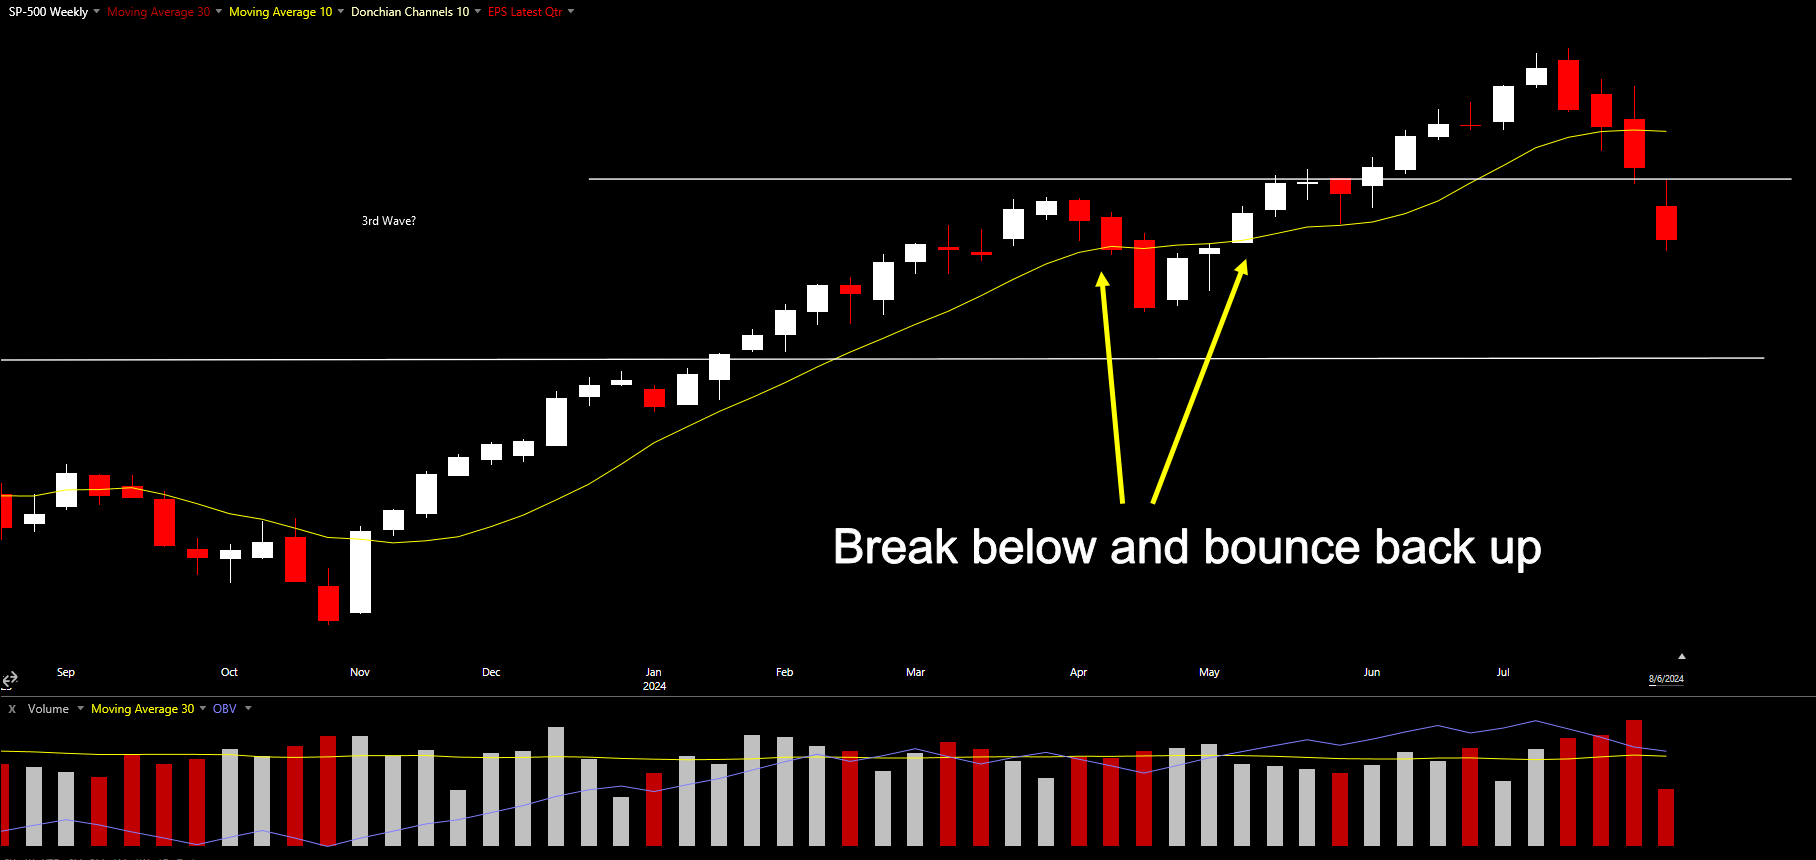
During your implementation of this strategy, you'll often encounter situations where the market dips below the 10-week SMA and then recovers. Here's how to handle this scenario effectively:
Recognize the Scenario
The S&P 500 drops below the 10-week SMA
You've tightened stop-losses on your positions
Within a few weeks, the S&P 500 rises back above the 10-week SMA
Some of your stocks have remained strong, not triggering the tightened stop-losses
Assess Your Positions
Identify which stocks have survived the dip without triggering stop-losses
Note their current prices and your tightened stop-loss levels
Adjust Stop-Losses Strategically
Do not immediately lower your stop-losses
Keep the tightened stop-losses in place.
NEVER lower stop loss.
Plan to readjust to your normal trailing stop percentage as the stock price increases
Implement the "High-Water Mark" Approach
Wait for each stock to reach a new "high-water mark" (a significant price increase)
Once the stock price has increased sufficiently, reset your trailing stop-loss
Example:
Current stock price: $20
Current (tightened) stop-loss: $18
Wait until the stock reaches ~$26 (30% above current stop-loss)
Then set new trailing stop at your normal percentage (e.g., 30-40% below $26)
Monitor and Repeat
Continue to monitor each position individually
Apply this approach to each stock as it reaches its new high-water mark
Remember, different stocks may recover at different rates
Key Considerations for Implementation
Stay Disciplined: The power of this strategy lies in its systematic approach. Resist the urge to override the signals based on hunches or emotions.
Monitor Regularly: Check the S&P 500's position relative to its 10-week MA weekly. This is your radar, keeping you informed of changing market conditions.
Be Prepared for False Signals: Sometimes the market will briefly cross the 10-week MA before reverting.
Why This S&P 500 Moving Average Strategy Works
As we've journeyed through the mechanics and implementation of our S&P 500 trend following strategy, you might be wondering: What makes this approach so effective? Let's unpack the key elements that give this strategy its power and reliability.
Trend Following: Aligning with Market Momentum
Riding the Wave: By aligning your investments with the market's overall direction, you're positioning yourself to benefit from its momentum. When the S&P 500 is above its 10-week moving average, you're swimming with the tide of market optimism and growth.
Avoiding Undertows: Conversely, when the index falls below the moving average, you're stepping back from potential downward spirals. It's like avoiding a riptide by staying on the beach until conditions improve.
Capitalizing on Market Psychology: Trends often persist due to collective market psychology. Bull markets can feed on themselves as optimism breeds more buying, while bear markets can spiral as fear leads to selling. This strategy helps you capitalize on these psychological patterns.
Risk Management in Trend Following
In the world of investing, protecting your capital is just as important as growing it. This strategy shines in its approach to risk management.
Systematic Risk Control: By tightening stop-losses in bearish conditions, you're systematically controlling risk. It's akin to automatically battening down the hatches when storm clouds gather, rather than waiting for the rain to start.
Preserving Gains: In long-running bull markets, this strategy helps you stay invested to capture gains, while still providing a mechanism to protect those gains when the trend reverses.
Emotional Control in Stock Market Investing
One of the biggest enemies of successful investing is our own emotions. Fear and greed can lead to impulsive decisions that derail even the best-laid plans. This strategy acts as an emotional circuit breaker.
Objective Decision Making: By basing decisions on the clear, binary signal of the S&P 500's position relative to its moving average, you reduce the impact of emotional biases.
Reducing Stress: Knowing you have a systematic approach to follow can significantly reduce the stress of investing. Instead of constantly second-guessing yourself, you have a clear framework for action.
Consistency Over Time: Emotional decisions often lead to buying high and selling low. This strategy encourages a more consistent approach, potentially leading to better long-term results.
Capital Preservation Techniques
In the grand game of investing, sometimes the best offense is a good defense. This strategy excels at preserving capital during market downturns.
Timely Defensive Moves: By signaling when to adopt a more defensive posture, this strategy helps protect your capital when market conditions deteriorate. It's like knowing when to come in from the rain before you get soaked.
Avoiding Major Drawdowns: While no strategy can completely eliminate losses, this approach aims to help you avoid the worst of major market drawdowns. By potentially getting you out of the market or reducing your exposure during prolonged downturns, it can help preserve your capital for future opportunities.
Compound Growth Protection: Remember, a 50% loss requires a 100% gain just to break even. By focusing on capital preservation during tough times, this strategy aids in maintaining the power of compound growth over the long term.
In essence, this S&P 500 moving average strategy works because it aligns you with market trends, manages risk systematically, controls emotional decision-making, and emphasizes capital preservation. It's not about predicting the future or timing the market perfectly. Instead, it's about surfing the waves of market trends, knowing when to ride and when to step back, always with an eye on protecting and growing your investment over the long haul.
By combining these elements, you create a robust framework for navigating the complex world of stock market investing. It's a strategy that doesn't just react to market changes but positions you to potentially benefit from them, all while keeping your financial goals and risk tolerance at the forefront.
Disclaimer
The information provided here is for educational and entertainment purposes only and should not be construed as financial advice. I am not a licensed financial advisor, and the content presented does not constitute professional financial guidance. Any financial decisions you make should be based on your own research, judgment, and consultation with qualified professionals. The material shared here may not be suitable for all individuals or situations. Always consider your personal circumstances and seek personalized advice from a certified financial expert before making any investment or financial choices.